Graphical data analysis
Current Article Analysis
In our current implementation, we utilize the PyMuPDF library (PyMuPDF Documentation) for reading article PDF files. This versatile tool allows us to extract a wide range of information from a file, including:
- Text Content: Extracting the actual text.
- Text Attributes: Details such as font, size, and color.
- Document Structure: Information on paragraph structure, images, tables, and more.
PyMuPDF is one of the most popular libraries in this domain, offering many features not available in other tools. Therefore, we consider it an above-average example for pdf-readers.
The extraction of textual data is performed as follows (screenshots of the relevant code steps are attached):
1. Data reading.
We collect all the data from the file along with its characteristics that the text reader can get;
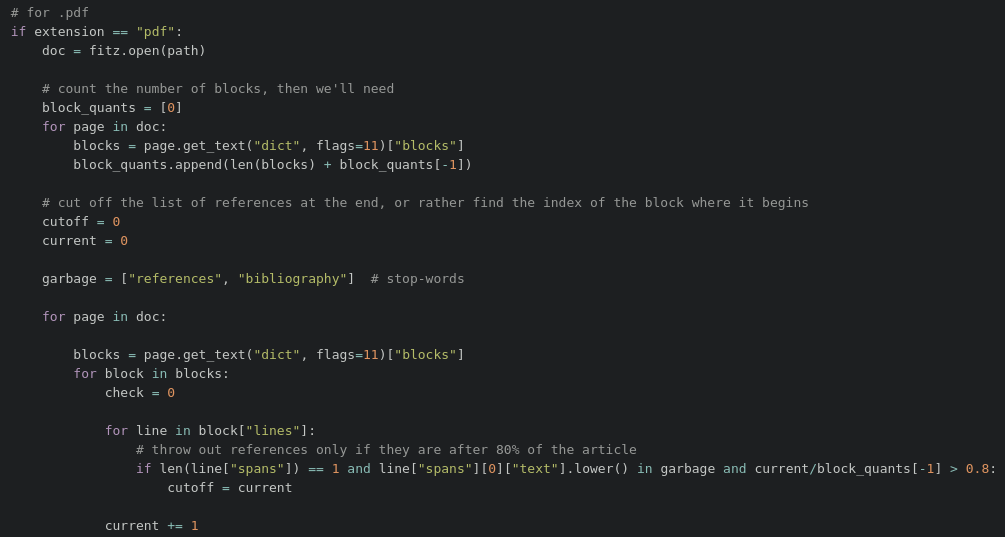
2. Text characteristic analysis.
We look at the fonts and sizes of different text parts, and calculate how much information there is with such and such parameters;
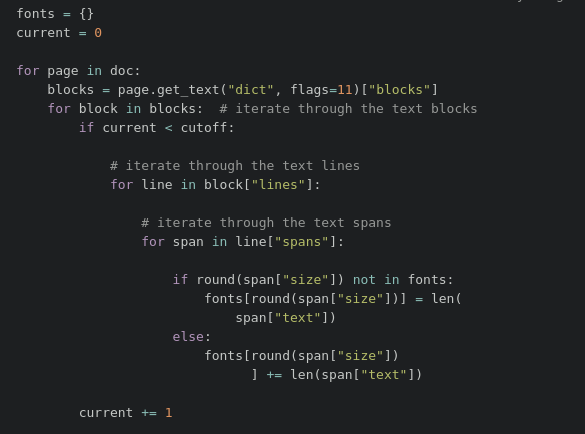
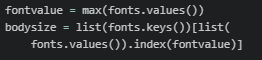
3. Maximum font and size values.
We select the font and size that is contained in the text the most;
4. Unused data elimination.
All other data is considered as secondary text and is not further analyzed.
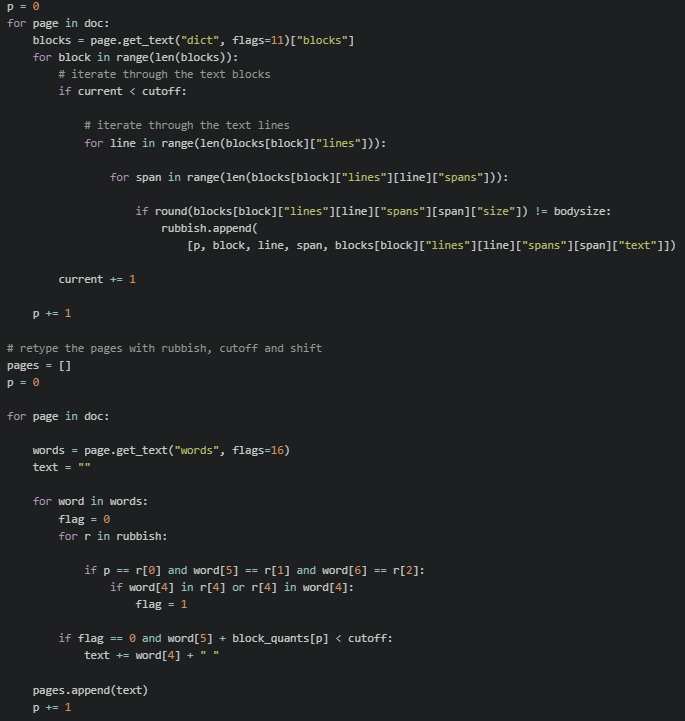
This approach helps avoid certain text elements that could degrade the quality of the graph content, such as formulas, titles, running titles, footnotes, and reference lists. These entities are challenging for the current implementation of the PrivateAI AI model to analyze and can be excluded without losing informativeness.
A similar processing method is applied to .docx documents using the docx Python library (Python-Docx Documentation). This ensures consistent and efficient extraction of relevant data from both PDF and DOCX files.
Table and Image Content Analysis
Current Limitations
At present, the content of tables and images is only analyzable if it can be read by the text reader function. Typically, such information undergoes the same processing described earlier and is often excluded because it does not match the characteristics of the main text. As a result, information from tables and charts is usually not included in the final knowledge graph.
Challenges in Table and Image Data Extraction
- Tables:
- Often contain numeric data that cannot be transformed into the triplet representation used for building graphs.
- Frequently include individual words in cells without complete sentences or explanations, making it difficult to construct clearly defined graphs.
- Can have complex structures with sub-rows and sub-columns that are challenging to analyze algorithmically.
- Images:
- Generally inserted as solid objects, preventing programmatic separation of different lines, texts, and numbers.
- Even with detailed image reading, interpreting the data remains undefined, and converting it into triplets is problematic.
Due to these complexities, analyzing table and image content using the same algorithms applied to usual text is not feasible.
Conclusion
Interpreting tabular and graphical data into text and subsequently into triplets is primarily an AI-related task. To address this challenge, the following steps are necessary:
- Explore Specialized Tools:
- Identify and test specialized AI-powered tools for analyzing tabular and graphical data.
- Test on LLMs:
- Evaluate the capability of large language models (LLMs) to perform such analyses.
- Research Approaches:
- Investigate methods and approaches for AI-powered analysis of tabular and graphical data.
This task has not been prioritized as our focus has been on the initial implementation of knowledge graphs and improving the quality of extracted triplets.